Last update: Nov 21th, 2018
tested using firmware 11.1
If you read about slowloris, you always read about NetScaler doing a great job. Tests in our lab environment show: NetScaler will successfully block these attacks. And there is hardly anything we have to do about it: It’s built into the system. Great news indeed!
The only thing we have to do is reduce client idle timeout to a lower value (default 180 seconds). I’d propose something below 20 seconds.
Unfortunately NetScaler will not log these attacks. WTF? Yes, that’s true. NetScaler won’t log a blocked slowloris attack. I recently set up a Citrix NetScaler WAF in the lab environment of a big bank, and they wanted me to log these Slowloris. I understand very well, why they want to log these. However we can’t.
This blog article could be over right now, but I did some research. Of course we have counters for this kind of attack. And we make many of them available via NITRO. So it could be possible, to do logging based on NITRO calls. Lets dig a little bit into NITRO. To do so I open my browser and surf to https://SNIP/nitro/v1/stat/protocolhttp (SNIP is the subnet address of my NetScaler). After logging on it returns a JSON list of counters. Most of them are of no importance for us, but I’m interested in httperrincompleteheaders.
 That’s a good point to start from!
How to log httperrincompleteheaders on Citrix ADC / NetScaler
So my approach would be like this:
- do a query to NITRO API and store the results in a NetScaler variable.
- log, if this counter increases.
There are some obstacles to overcome.
First of all, we need to find a way to query NetScaler NITRO from within a NetScaler. And here it is:
define a HTTP Callout.
We may use an HTTP callout to query Nitro. That’s quite simple to do, it’s just an http get. Problem here is authentication. I found a solution, unfortunately it’s not a very elegant one.
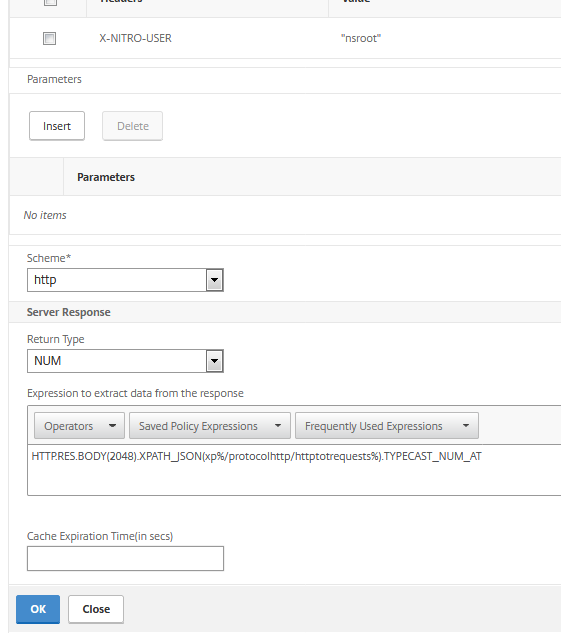
add policy httpCallout query_incomplete_header_neu_num -IPAddress 192.168.30.110 -port 80 -returnType NUM -urlStemExpr "\"/nitro/v1/stat/protocolhttp\"" -headers X-NITRO-USER("nsroot") X-NITRO-PASS("nsroot") Accept("text/html,application/xhtml+xml,application/xml;q=0.9,*/*;q=0.8") host("192.168.30.110") -scheme http -resultExpr "HTTP.RES.BODY(2048).XPATH_JSON(xp%/protocolhttp/httpincompleteheaders%).TYPECAST_NUM_AT"
In GUI, callouts are located in AppExpert
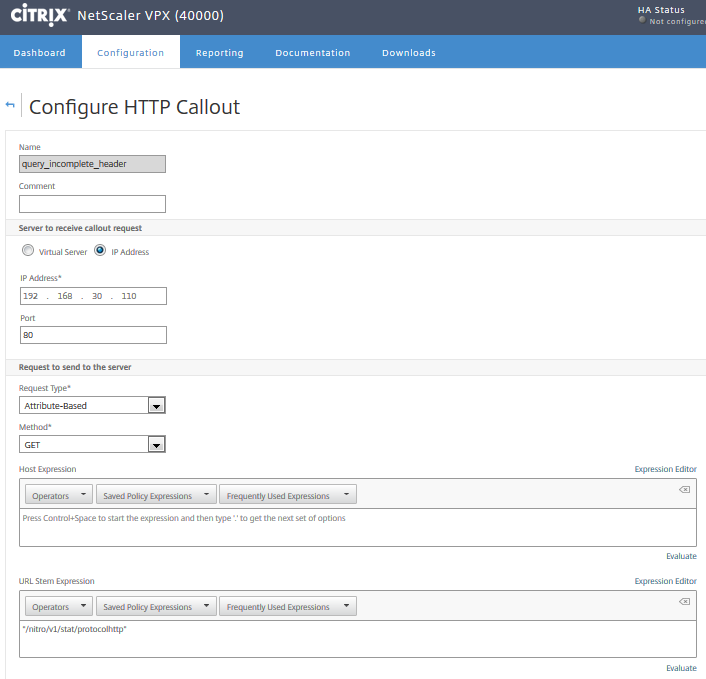
What’s in this policy?
- -IPAddress: This is the IP address we’re actually calling. It has to be a SNIP, HTTP access enabled.
- -Port: The port, usually 80 (SSL doesn’t make any sense for NetScaler internal communication; it’s waste of ressources)
- -returnType: The type of data this callout has to return. Possible values: TEXT, NUM or BOOL. We’re interested in numbers.
- -urlStemExpr: The URL we call (/nitro/v1/stat/protocolhttp)
- -headers: headers we have to set. They are nescessary, see below
- X-NITRO-USER(“nsroot”) username
- X-NITRO-PASS(“nsroot”) password for this user
- Accept(“text/html,application/xhtml+xml,application/xml;q=0.9,*/*;q=0.8”) the encoding, our policy can understand
- host(“192.168.30.110”) server’s hostname. Don’t skip this one!!!
- -scheme: htt/https
- -resultExprthe: data we’re interested in
This query should return a number: The number of requests containing incomplete headers. So we have to take a closer look at the http response. In RAW format it would look like this:
{ "errorcode": 0, "message": "Done", "severity": "NONE", "protocolhttp": { "spdytotst
reams": "0", "spdystreamsrate": 0, "httptotrequests": "13211", "httprequestsrate": 3,
 "httptotresponses": "13209", "httpresponsesrate": 3, "httptotrxrequestbytes": "52418
9", "httprxrequestbytesrate": 84, "httptotrxresponsebytes": "2498358", "httprxrespons
ebytesrate": 1004, "httptotgets": "1244", "httpgetsrate": 0, "httptotposts": "12", "h
ttppostsrate": 0, "httptotothers": "11955", "httpothersrate": 2, "httptot10requests":
 "0", "http10requestsrate": 0, "httptot11requests": "2102", "http11requestsrate": 0,
"httptotclenrequests": "20", "httpclenrequestsrate": 0, "httptotchunkedrequests": "0"
, "httpchunkedrequestsrate": 0, "httptottxrequestbytes": "0", "httptxrequestbytesrate
": 0, "httptot10responses": "4166", "http10responsesrate": 1, "httptot11responses": "
9043", "http11responsesrate": 2, "httptotclenresponses": "8185", "httpclenresponsesra
te": 2, "httptotchunkedresponses": "1", "httpchunkedresponsesrate": 0, "httperrnoreus
emultipart": "0", "httperrnoreusemultipartrate": 0, "httptotnoclenchunkresponses": "4
166", "httpnoclenchunkresponsesrate": 1, "httptottxresponsebytes": "0", "httptxrespon
sebytesrate": 0, "httperrincompleteheaders": "0", "httperrincompleterequests": "0", "
httperrincompleterequestsrate": 0, "httperrincompleteresponses": "0", "httperrincompl
eteresponsesrate": 0, "httperrserverbusy": "4", "httperrserverbusyrate": 0, "httperrl
argecontent": "0", "httperrlargechunk": "0", "httperrlargectlen": "0", "spdyv2totstre
ams": "0", "spdyv2streamsrate": 0, "spdyv3totstreams": "0", "spdyv3streamsrate": 0 }
}
We have to extract data behind “httperrincompleteheaders”: and before the next “, and convert this to a number. A possible string would be:
HTTP.RES.BODY(20480).AFTER_STR("httperrincompleteheaders\": \"").BEFORE_STR("\"").TYPECAST_NUM_AT
But our experience shows: This is inefficient! So we need to find a better way: NetScaler understands JSON. We will rather use this one:
HTTP.RES.BODY(2048).XPATH_JSON(xp%/protocolhttp/httperrincompleteheaders%).TYPECAST_NUM_AT
HTTP Callout is finnished!
Next we need a NetScaler variable.
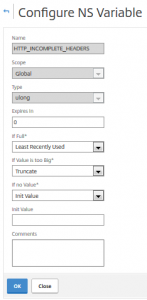
Creating a Variable to store our data in
Citrix NetScalers have built in functionality called variables. They can be created either from GUI or command line.
add ns variable HTTP_INCOMPLETE_HEADERS -type ulong
In GUI, variables are located in AppExpert
 Assigning data to this variable

It’s surprisingly difficult to assign data to a variable! A simple $variable=7 won’t do the job. Instead we have to create an assignment. Luckily assignments are – at the same time – policy expressions for responder and rewriting policies. So we’ll have to create an assignment for this variable:
add ns assignment set_incomplete_header -variable "$HTTP_INCOMPLETE_HEADERS" -set "SYS.HTTP_CALLOUT(query_number_req)"
In GUI assignments are located in Appexpert
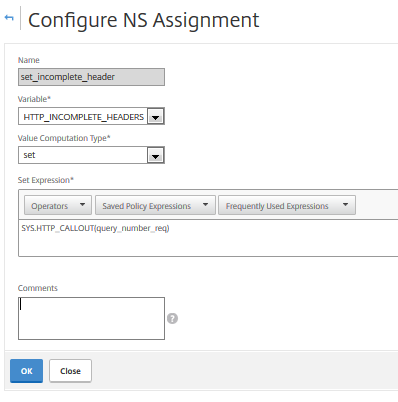
This assignment will replace the value in my variable defined above with the return value of the callout created first.
The trigger
We could check for slowloris when ever a request comes in, however this may be way too often, as NITRO calls are of some overhead for our system. So I created a trigger. I won’t do a step by step instruction for this here, I will just give you an idea how it works:
I create a Citrix NetScaler service of type ANY, pointing “somewhere”. (it does not matter as we won’t use this service at all). I assign a health monitor of type HTTP to it, specifying the IP the HTTP vServer (CS or LB does not matter). This health monitor periodically sends HTTP requests there, they are easy to identify and we are free to define the frequency we like. This health monitor is our trigger.
The policies we will use
Next to do is creating policies. We may use responder or rewriting policies (I used responder policies, but it does not matter). This policy will do the callout and compare it to the stored value in our Citrix NetScaler variable. We would need to bind a logging policy to it (see here). Unfortunately this is not possible. It’s a restriction in NetScaler: “Log action is not suported with assignment action“. So we have to do two identic policies, one doing nothing but logging, the other incrementing the counter.
Logging policy
add responder policy log_IncompleteRequests "CLIENT.IP.SRC.EQ(192.168.30.110) && $HTTP_INCOMPLETE_HEADERS.EQ(SYS.HTTP_CALLOUT(query_incomplete_header)).NOT " NOOP -logAction Log_new_number rule "CLIENT.IP.SRC.EQ(192.168.30.110) && $HTTP_INCOMPLETE_HEADERS.EQ(SYS.HTTP_CALLOUT(query_incomplete_header)).NOT "
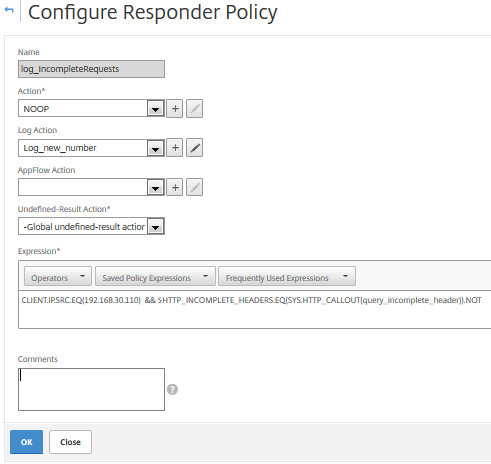 This Citrix NetScaler responder policy checks if client’s IP is the SNIP and the incomplete header counter increased. If so the responder policy actually does nothing (NOOP), but it logs.
incrementing policy
add responder policy count_IncompleteRequests "CLIENT.IP.SRC.EQ(192.168.30.110) && $HTTP_INCOMPLETE_HEADERS.EQ(SYS.HTTP_CALLOUT(query_incomplete_header)).NOT" set_incomplete_header rule "CLIENT.IP.SRC.EQ(192.168.30.110) && $HTTP_INCOMPLETE_HEADERS.EQ(SYS.HTTP_CALLOUT(query_incomplete_header)).NOT"
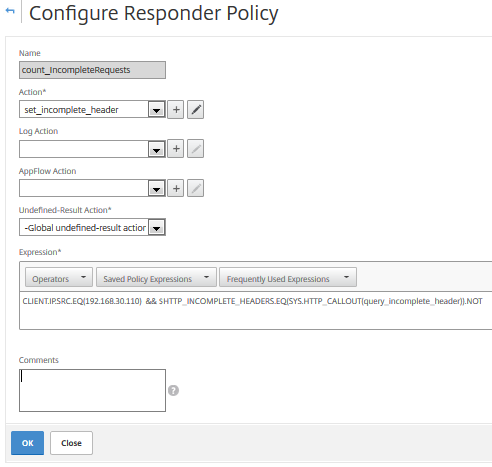 This policy can’t log (see above), however set the counter. Policy expression is the same as above.
Binding the policies
The last task is binding these policies. Simple like that. Bind the logging policy first with “goto next”, bind the incrementing policy (with “goto next”, if you still have more policies to check for).
I hope you liked my tricks. I’d be happy to hear your thoughts on this, just drop some words in the comment box to let me know about your thoughts. Feel free to link to my page when ever you like.
Johannes
HI,
Great article on WAF, but i do not understand how an incomplete header correlates to a slowloris attack ?
Best Regards Kai
You are right: They don’t have to do anything with slowloris. However they increase if you detect a slowloris attack and block the request.
How does a slowloris attack work? The attacker sends requests not fitting into a single TCP package. This may be done by sending both oversized requests in undersized TCP packages, as slow as any possible. The next request will contain more headers, the next more and so on. NetScaler protects very well from this kind of attack by just terminating the request, however it does not expose counters to NITRO. As these requests don’t complete, there are counters increasing: incomplete headers (as the client was not successful sending all headers) and incomplete requests.
So doing so does not detect a slowlori attack, instead it detects “the detection of slowlori attacks”. Do you agree?
Hi,
great article, but someone that is not very familiar with the NetScaler maybe a little bit confused, because some names in the example don”t match. The policy has also a wrong syntax. Not sure if that is just due to formatting on the website.
In your example, what do you actually log? From your initial use case it sounded like the logging of the actual attacks should be logged.
But what is described would log some custom message, if the “httperrincompleteheaders” counter goes up, triggered via that service with the custom health check. Unless I miss understood the post.
If that is the case, then the log message just contains some text that there have been some attacks or requests with incomplete headers.
But still no log messages for important things like from where it came. Am I right?
These policies should work. Maybe there is a formatting problem. I’ll go into this later. (I see there are some more mistakes in the text)
If you do slow loris, you send HTTP requests with complete headers, but you never finish, continue to send more and more headers. It’s an eternal request. This is done to fill up the victim’s buffers and crash the victim. We don’t have counters for this, so I can’t get this process. But NetScaler starts cleaning up these pending HTTP requests as it drops HTTP requests that don’t finish in a timely manner. And therefore counters for incomplete requests go up.
You are right: I have no clue where these attacks came from. I can’t get the attack itself, I can just see: It is going on. I had some discussions with Citrix ADC – WAF development team about this issue and they told me: No way to get this information. The only thing I can do: Tell you, there is something going on. In my customer’s environment my logging triggers a process starting excessive logging from the firewall. They had already been successful tracking some attacks (but they end up finding out the attack came from zombie PCs all over the world)