No doubt, monitoring a WAF is an important thing to do. It helps to find attacks and their sources for forensic purposes and is needed to find false positives as well. How to do it?
Citrix NetScaler WAF logs locally, that’s great for real-time logging and trouble shooting, but it may also log to external sources like Citrix Application Delivery Manager (ADM), that’s great for long-time logging and forensics.
Display real-time WAF events
During testing, it might be beneficial to see events on the WAF in real-time. This can be done from the Citrix NetScaler shell:
> shell

Copyright (c) 1992-2013 The FreeBSD Project.

Copyright (c) 1979, 1980, 1983, 1986, 1988, 1989, 1991, 1992, 1993, 1994

The Regents of the University of California. All rights reserved.
# cd /var/log

# tail -F ns.log | grep waf_prof_test
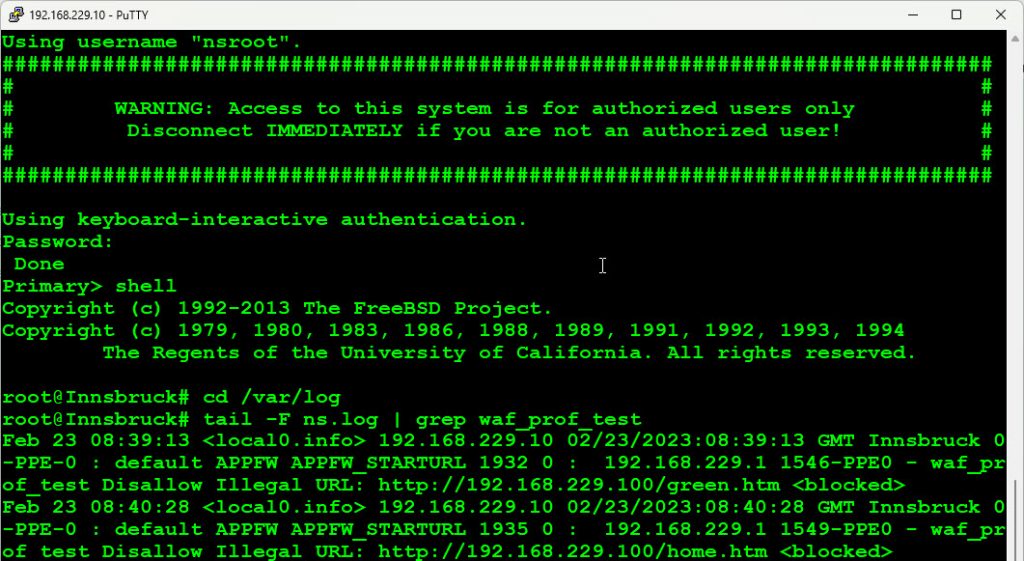 In this case, waf_prof_test is the name of the profile in use (not a great name for a profile, to be honest). Instead, you could also grep for
 APPFW (all application firewall related events for all profiles, or add an other | grep STARTURL to grep for start URL related events only.
Looking at my screenshot, you see this event:
Feb 23 08:39:13 <local0.info> 192.168.229.10 02/23/2023:08:39:13 GMT Innsbruck 0-PPE-0 : default APPFW APPFW_STARTURL 1932 0 : 192.168.229.1 1546-PPE0 - waf_prof_test Disallow Illegal URL: http://192.168.229.100/green.htm <blocked>
- They came up today (February 23 by 8:39).
- The log facility is 0 (that’s normal).
- The IP of this NetScaler had been 168.229.10.
- Time on NetScaler had been 02/23/2023:08:39:13 GMT.
- The hostname of this NetScaler is Innsbruck
- The packet had been processed by packet engine 0-PPE-0
- It had been a start URL violation (APPFW APPFW_STARTURL)
- It had been the 1932nd event since boot
- The IP address of the user had been 168.229.1
- The name of the WAF profile had been waf_prof_test
- The URL accessed had been http://192.168.229.100/green.htm
This request had been <blocked> (it could also have been <not blocked> or <transformed>).
The grep command
My scripts usually deal with grepping for content. Grep is case-sensitive, so grepping for WAF_prof_test would not be successful in my case. It has several useful switches:
-I make search case-insensitive
-E Search string is REGEX
-c don’t print output, just count the number of matching lines
-v search for lines not containing the search string
(For full list of arguments: man grep)
Watching historic events
Events that happened since the beginning of the last hour
Citrix NetScalers do a log-file rollover every hour. Therefore, the current log-file (/var/log/ns.log) will be compressed and backed up on an hourly base, at :00 sharp, if the current log file is bigger than 100 kB. An event that occurred during the last hour is in the current non-compressed log-file, elder events are in compressed versions of log-files.
Primary> shell

Copyright (c) 1992-2013 The FreeBSD Project.

Copyright (c) 1979, 1980, 1983, 1986, 1988, 1989, 1991, 1992, 1993, 1994

The Regents of the University of California. All rights reserved.

# cd /var/log

# grep waf_prof_test ns.log

Feb 23 08:39:13 <local0.info> 192.168.229.10 02/23/2023:08:39:13 GMT Innsbruck 0-PPE-0 : default APPFW APPFW_STARTURL 1932 0 :  192.168.229.1 1546-PPE0 - waf_prof_test Disallow Illegal URL: http://192.168.229.100/green.htm <blocked>

Feb 23 08:40:28 <local0.info> 192.168.229.10 02/23/2023:08:40:28 GMT Innsbruck 0-PPE-0 : default APPFW APPFW_STARTURL 1935 0 :  192.168.229.1 1549-PPE0 - waf_prof_test Disallow Illegal URL: http://192.168.229.100/home.htm <blocked>

#
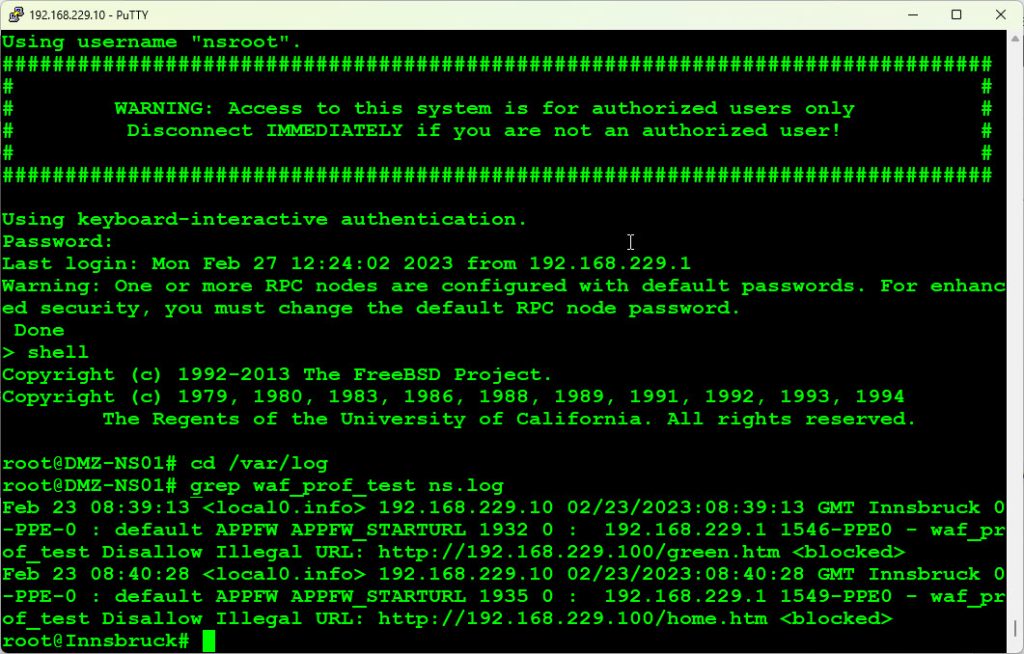
The meaning of the log entries is the same as with current logs.
Events that happened before the beginning of the last hour
As described before, there are “old logs”, meaning, logs that came up before the beginning of the current hour. These logs are usually compressed (exception: The current ns.log gets saved uncompressed during reboot, this happened to ns.log.4). So you see: Historic logs stored on the NetScaler won’t be much elder than 24 hours!
# ls -l ns.log*

-rw-------  1 root  wheel      81 Feb 23 09:00 ns.log

-rw-------  1 root  wheel    4998 Feb 23 09:00 ns.log.0.gz

-rw-------  1 root  wheel    8514 May  2  2022 ns.log.1.gz

-rw-------  1 root  wheel    9316 May  2  2022 ns.log.2.gz

-rw-------  1 root  wheel   12879 Apr 27  2022 ns.log.3.gz

-rw-------  1 root  wheel  135897 Apr 22  2022 ns.log.4

-rw-------  1 root  wheel    8120 Apr 22  2022 ns.log.5.gz

-rw-------  1 root  wheel   13863 Apr 19  2022 ns.log.6.gz

-rw-------  1 root  wheel    8861 Apr 19  2022 ns.log.7.gz

-rw-------  1 root  wheel   18751 Apr 19  2022 ns.log.8.gz

-rw-------  1 root  wheel   70742 Apr 19  2022 ns.log.9.gz
There is a total of up to 26 historic logs, starting from ns.log.o.gz to ns.log.25.gz, so we usually have logs for the last 24 hours.
Primary> shell

Copyright (c) 1992-2013 The FreeBSD Project.

Copyright (c) 1979, 1980, 1983, 1986, 1988, 1989, 1991, 1992, 1993, 1994

The Regents of the University of California. All rights reserved.

# cd /var/log

# zcat ns.log.*.gz | grep waf_prof_test

Feb 23 08:39:13 <local0.info> 192.168.229.10 02/23/2023:08:39:13 GMT Innsbruck 0-PPE-0 : default APPFW APPFW_STARTURL 1932 0 :  192.168.229.1 1546-PPE0 - waf_prof_test Disallow Illegal URL: http://192.168.229.100/green.htm <blocked>

Feb 23 08:40:28 <local0.info> 192.168.229.10 02/23/2023:08:40:28 GMT Innsbruck 0-PPE-0 : default APPFW APPFW_STARTURL 1935 0 :  192.168.229.1 1549-PPE0 - waf_prof_test Disallow Illegal URL: http://192.168.229.100/home.htm <blocked>

#
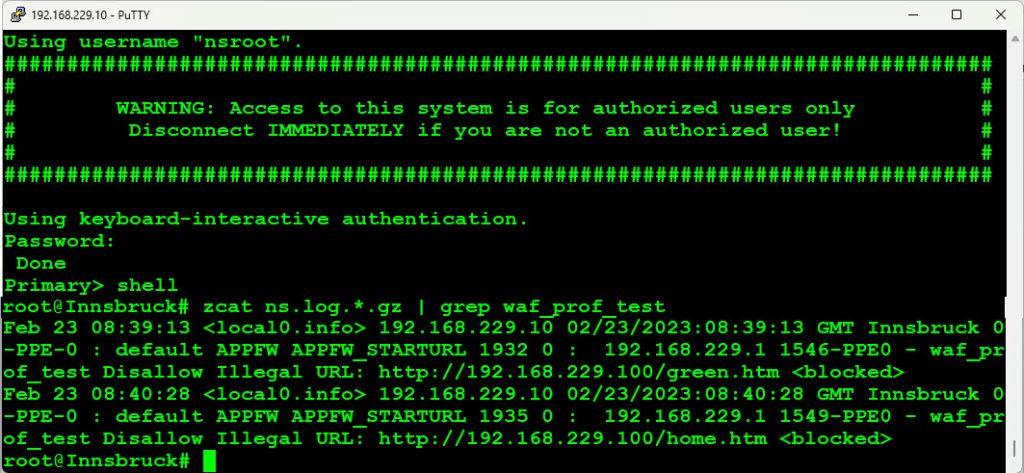 The meaning of the log entries is the same as with current logs.
The zcat command extracts all data within a .gz file to the standard output (usually screen or to whichever command you pipe it). We pipe this output to grep. The grep command searches for the string desired.
External logging solutions
It is Citrix’s leading practice to log to external syslog servers to keep logs for a long time. The Citrix ADM (on-premise) or the Citrix ADM service (in Citrix cloud) can be a logging solution, see Using ADM as a Syslog server. But any syslog server will do. You may bind syslog policies to a load-balancing or content-switching vServer, so that it will receive logs from only that particular vServer.
Using Citrix Application Delivery Manager (ADM) to monitor the WAF
Requirements, Setup
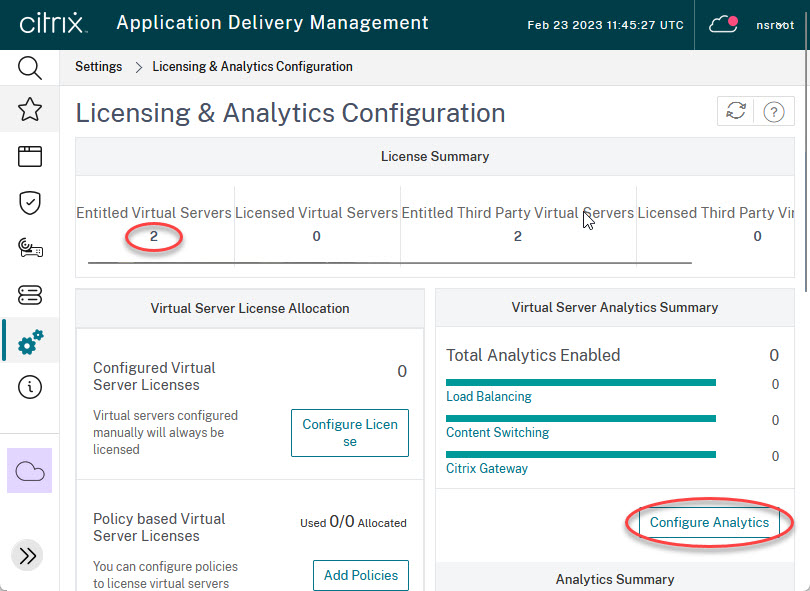
Analytics needs proper licensing. Surf to the ADM, log on and go to Settings -> Licensing & Analytics Configuration to see if license requirements are met.
My test environment got 2 licenses, and currently, no vServer is enabled. The Number of Licensed Virtual Servers is the vServers with enabled analytics (none in my test environment). In my case, there are two licenses left to enable analytics for vServers. A brand new Citrix ADM or Citrix ADM Service always contains two licenses (this changed in early 2022), so my ADM does not contain any extra licenses.
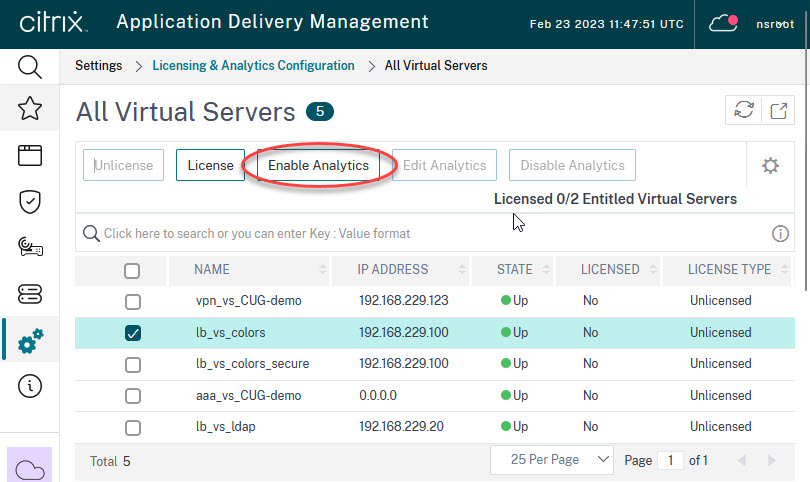 Next, click Configure Analytics, select a vServer and click Enable Analytics. Alternatively, you could also enable analytics from Infrastructure -> Instances.
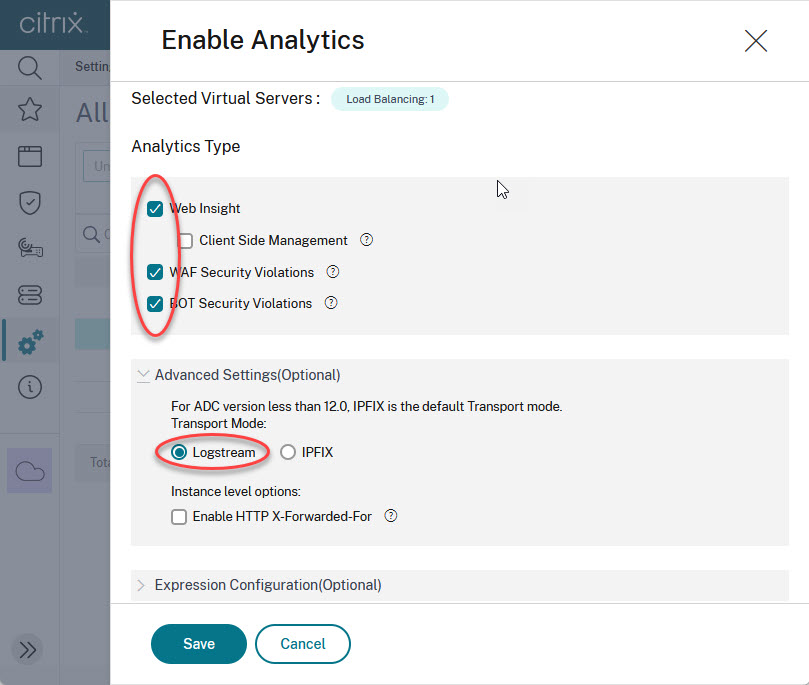 Select Web Insight, WAF Security Violations and BOT Security Violations (if you plan to use BOT management as well). Please double-check, if Logstream is turned on under Advanced Settings (Optional). Expression configuration does not need to get altered.
This will create an AppFlow policy on the NetScaler appliance and bind it to the vServer specified. You can find these policies on the NetScaler under System -> AppFlow.
Reports
You find reports in the Security section.
An overview
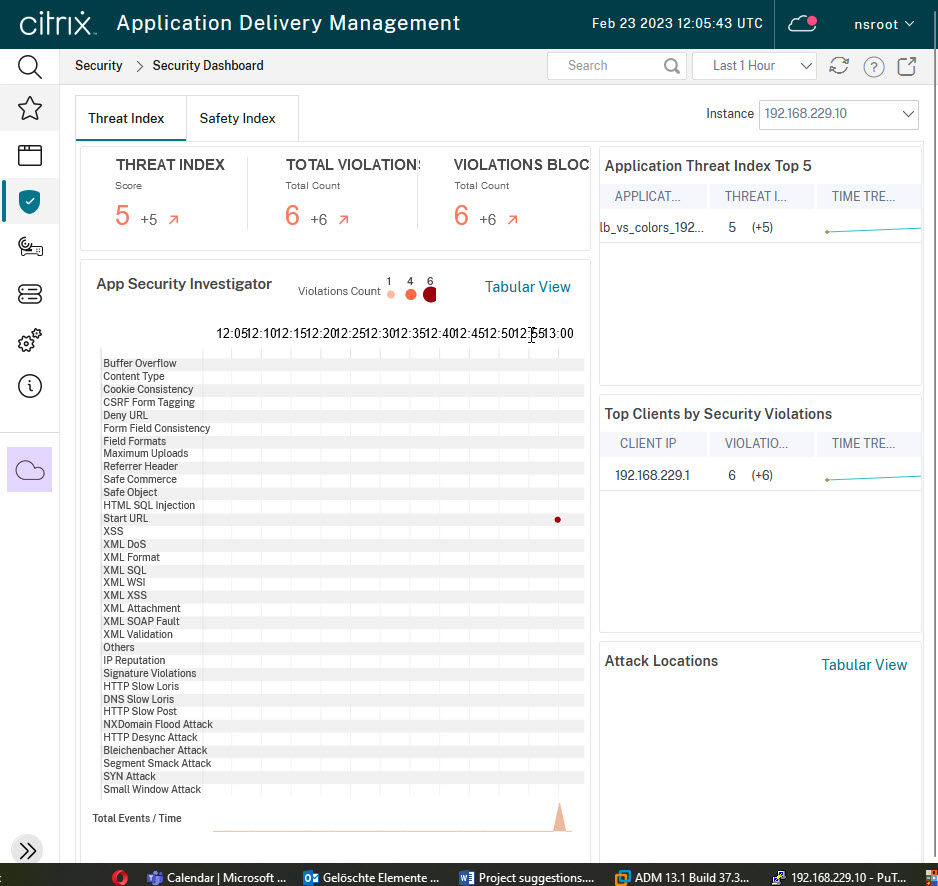
The Security Dashboard (Security -> Security Dashboard) gives a good overview of security violations.
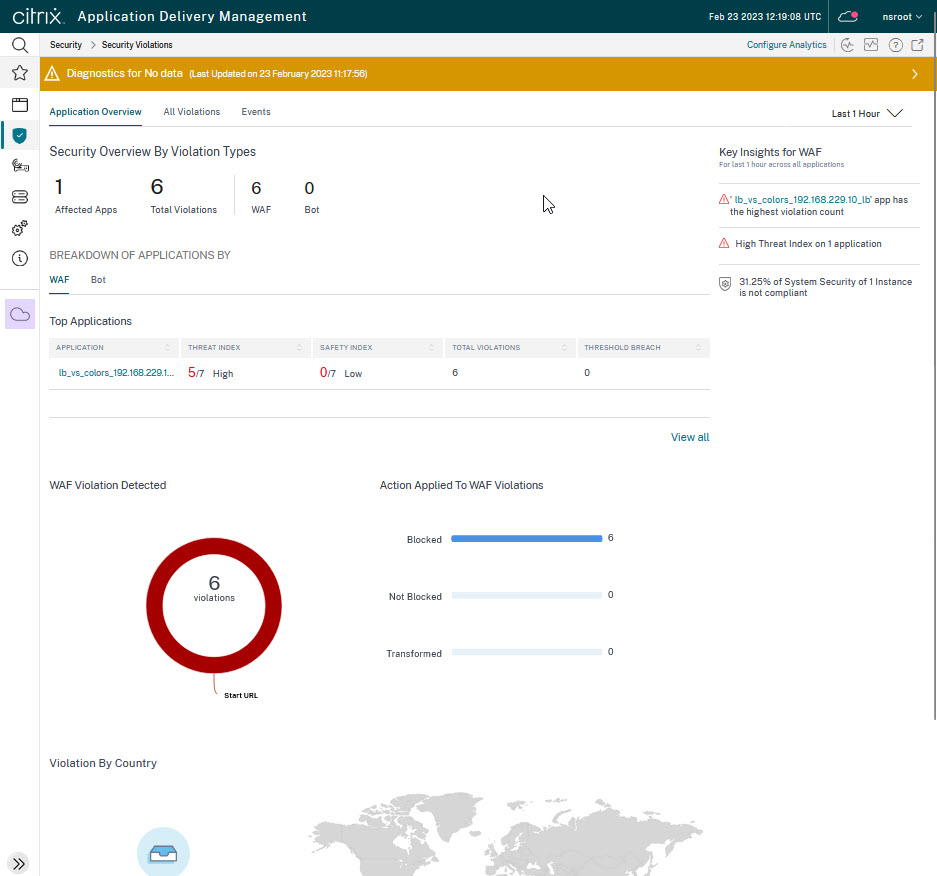
You can see, there had been threads at 13:00. It’s been some (less than 4) Start URL violations. The “Total Events / Time” indicator also spiked at that time. Because of these threads, the Thread Index had been rising, there had been a total of six violations, also with a rising tendency, and six violations had been blocked. The top five application list contains just one vServer: lb_vs_colors, the server I used for my test. Below, you can see, the misbehaving client had been 192.168.229.1. It would also tell you, where this attacker came from, the list is empty, as the attacker used a private IP address.
The display refreshes every five minutes, so you may not see violations in real-time, but with five minutes of time offset.
Security Violation dashboard
The Security Violation dashboard gives you another view on violations. There is also a map showing the source of violations.
You can see the same dashboard per application by clicking an application.
Using ADM as a Syslog server
ADM can be used as a syslog server. Syslog functionality currently is of no cost of licenses.
Set up syslog
Select Infrastructure -> Instances -> ADC. Click the ADC of interest and Configure Syslog.
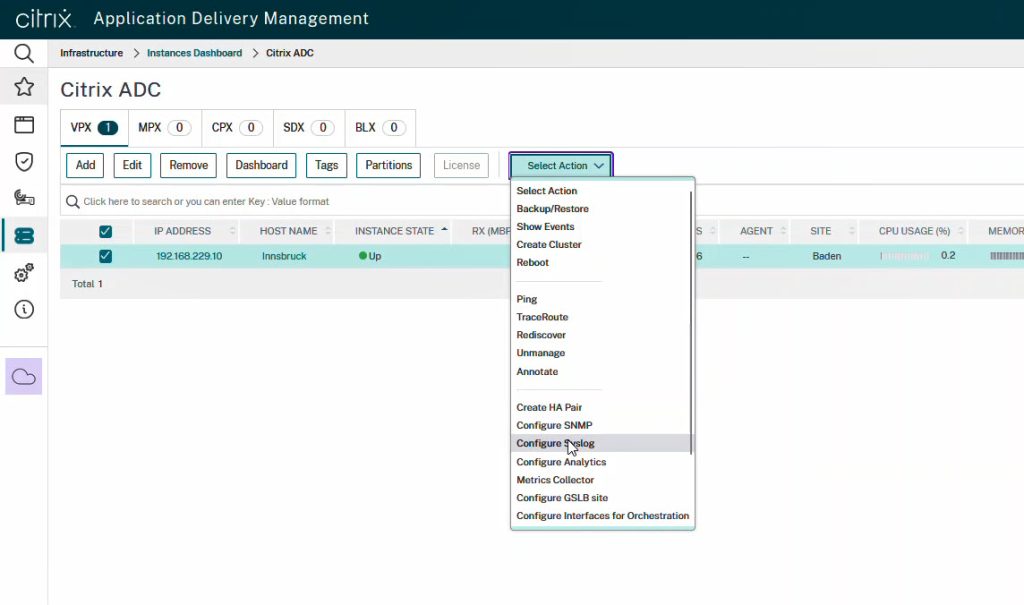 Syslog information can be found at Infrastructure -> Events -> Syslog Messages. Events can get filtered in the far right side
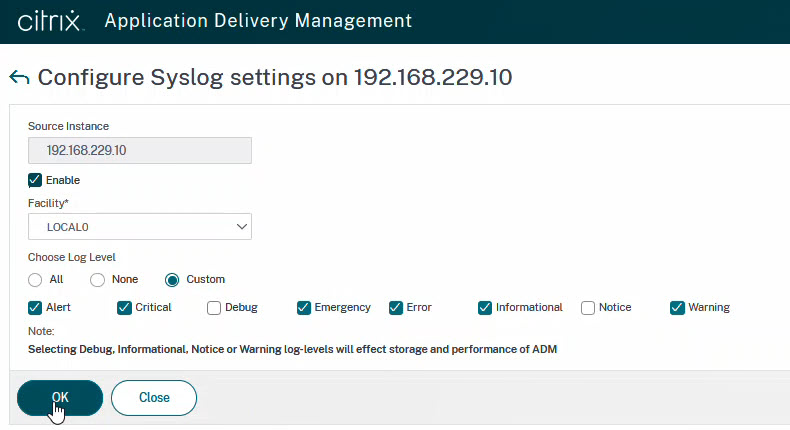 Don’t forget to enable syslog and set the facility and the log level according to your needs.
This will create a policy in ADC (System → Auditing → Syslog → Servers and System → Auditing → Syslog → Policies) and bind it globally. You may do changes to this policy in case they don’t fit folly your needs, for example, include user-configurable log messages.
Using syslog
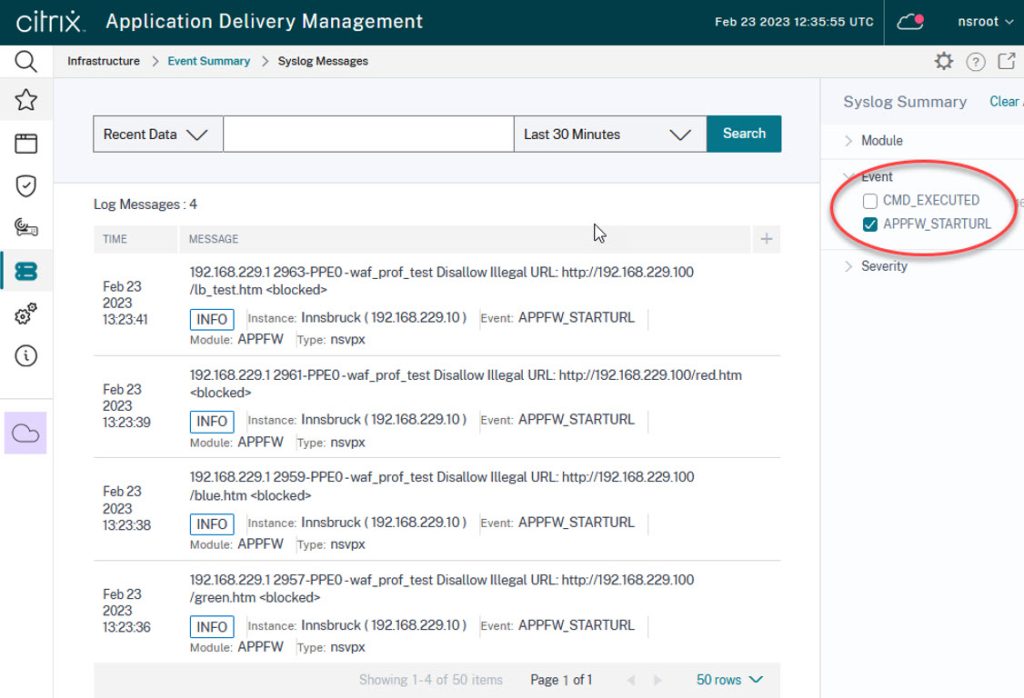 The syslog viewer can be found in Infrastructure → Events → Event Messages. You may filter events by Module, Category or Servity. The filter is on the far right side. There is also a built-in search functionality.
I hope, this blog post is of help to you. Drop me a message if you like it!

