I was so enthusiastic, when I found out about NetScaler admin partitions! What a great extension to existing NetScalers! However I got disillusioned finding out about limitations. It took me some time to find out how to overcome this issues, but there are still some features missing.
The feature I missed most is doing traces. It’s not listed in the compatibility list, so it’s intended to be there. But it is not! If you click into System and Diagnostics you’ll see just very little content, and definitely no nstrace (this is about NetScaler versions up to 11.1 48.10).
Citrix documentation is always right, and if it’s not, it’s right even though. So I tried to do a nstrace from commandline. It started and stopped without any problem. Unfortunately I could not find the output of my nstrace in /var/nstrace subdirectory.
So I searched for it, and found it in /var/partitions/<partitionname>/nstrace.
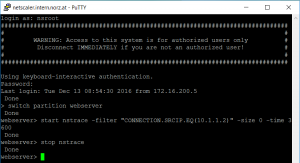
So that’s how I do an nstrace inside a NetScaler admin partition:
I use putty to connect to my NetScaler. Masochists might prefer to use the built in terminal from GUI, however I don’t tend to masochism.
 switch partition <partitionname>
start nstrace -filter “CONNECTION.SRCIP.EQ(<source IP>)” -size 0 -time 3600 -link
stop nstrace
So I log into my Citrix NetScaler. I change into my partition (currently partition names can’t auto complete, so make sure you know the name; show ns partition will list all partitions.
Next I start the trace. To do so I follow CTX120941.
start ns trace will simply start the trace. -filter will filter a connection. Usually you would use connection objects like CONNECTION.SRCIP.EQ(<source IP>) or CONNECTION.DSTIP.EQ(<destination IP>) to limit the amount of data captured. -size=<size> will limit the amount of data captured per packet. If you want to debug HTTP problems you would very likely set the size to 0, as this would capture all of the packet (0 sometimes means unlimited). -time=<time> will automatically stop the trace after <time> seconds.
After doing your trace you may execute a stop nstrace command to stop your trace. This is not needed if you set the time parameter, but I prefer to stop traces instead of setting a time parameter.
In the end you need to download the trace file. I usually use winscp as a secure FTP client, download it from /var/partitions/<partitionname>/nstrace and view content in your favourite network monitor. I prefer to use WireShark, as it fully supports NetScaler. Citrix support also uses WireShark.
Additional parameters for tracing
-tcpdump ENABLED switches to TCPdump format. TCPdump is a standard UNIX® format for network tracing. Different to NStrace it does not contain L1 information (ports), but it is understood with most network tracing utilities. You may want to use it together with -perNIC ENABLED if you want to debug routing problems. This will create a separate trace file pre NIC. You then have to scroll down both instances of your network monitor in parallel (and synchronize these 2 windows if you scroll down). However you may prefer to download free WireShark and use it instead as it understands NStrace: one window, all L1 information is contained in your trace.
–link Also trace filtered connection’s peer traffic. Only makes sense in combination with -filter. It will trace all traffic filtered plus all traffic resulting from your filtered traffic, so traffic from client to VIP and traffic from SNIP to your back end server. This is a very good one!
-mode SSLplain will decrypt all SSL traffic. Because of this you won’t see any SSL hand shake, instead, all SSL traffic will appear to be plain text. This may be beneficial if you want to debug encrypted traffic. Caution: this may expose sensitive data to you (the admin)
There are several more parameters. You may find them in Citrix NetScaler product documentation.
